Increase Ecommerce Conversion Rate [Google Analytics Health Check]
As an online shop owner you’re constantly looking for ways to increase your ecommerce conversion rate and sales.
You read blog posts, hire consultants and even study your competitors.
But with so much information available and so many routes to take, it’s easy to get frustrated and confused.
With this case study, I aim to remove your frustration.
You’ll follow along as I document my entire journey improving the conversion rate and profits of a real ecommerce business.
The best part is…I won’t hide anything…this detailed series of blog posts will reveal all the processes, financial and analytics data behind the case study (including dollar amounts).
So you can learn what’s really important when optimizing your ecommerce store for increased conversions and profits.
Here what you’ll learn following this series:
Part 1 (this post)
- How to create business objectives to measure your conversion process
- What is a customer theory
- How to audit your Google Analytics account to collect clean data
- What types of qualitative and quantitative data to collect
Part 2 – Read it here
- Ecommerce best practices & conventions
- Best ecommerce sites
- Popular ecommerce features and functionality
- How conventions fit into a CRO process
Part 3 – Read it here
- How to analyse your data and turn it into a/b test hypothesis
- Best practice for executing website design and code changes
Part 4 – Read it here
- Common mistakes to avoid and conventions to follow for a/b testing your website changes
Part 5
- The complete results of a site wide conversion optimization process and a/b test including the revenue and analytics data
I’m really excited and I hope you are too. Let’s jump in!
Meet Ecommerce Jewellery Store By Charlotte
Launched in 2012, cult jewellery label By Charlotte is inspired by renowned makeup artist Charlotte Blakeney’s passion for making women feel and look beautiful.
In order to help other ecommerce entrepreneurs succeed, Charlotte agreed to allow me to reveal everything in this in-depth case study.
How to plan a conversion optimization process for your online store
In conversion optimization as with any marketing effort it is important to follow a process.
The process gives you a strategic focus, no more running random campaigns and blindly copying other people’s a/b test case studies.
It also allows you to measure, learn and iterate on the process itself.
Without a proven process to follow, you’re just guessing and basically throwing stuff at the wall and hoping something sticks.
In order to improve Charlotte’s business we first need to understand what it looks like now.
This requires us to complete three main tasks in this first phase:
- Set the business objectives for the optimization process
- Create a customer theory
- Audit the Google Analytics account
Step 1: Set the business objectives for the optimization process
As with any marketing initiative it is important to set objectives to track and measure so you can understand if your efforts have been successful.
The best way to set your business objectives, KPI’s, goals and targets is to base them from historic data.
Let’s take a look at Charlotte’s business now:
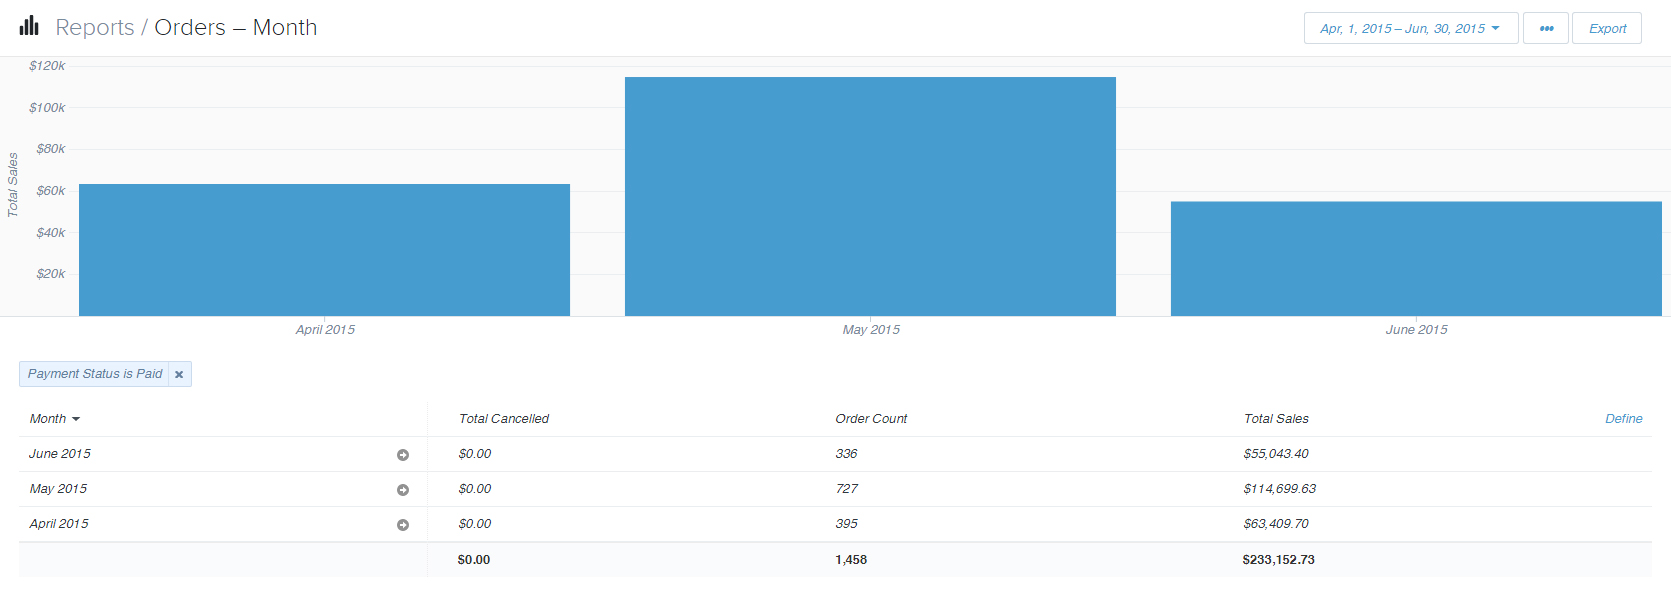
(The data we will look at is from the 1st of April until the 30th of June 2015)
In the last three months Charlotte has grossed $233,152.73 in sales (good work Charlotte!).
Her monthly averages have been as follows.
Monthly averages for the last quarter
1458 sales / 3 months = 486 average sales per month
$233,152.73 gross revenue / 3 months = $77,717.57
Average basket or order value = $158.78
CRO TIP: Data lies, dig deeper into your analytics and segment!
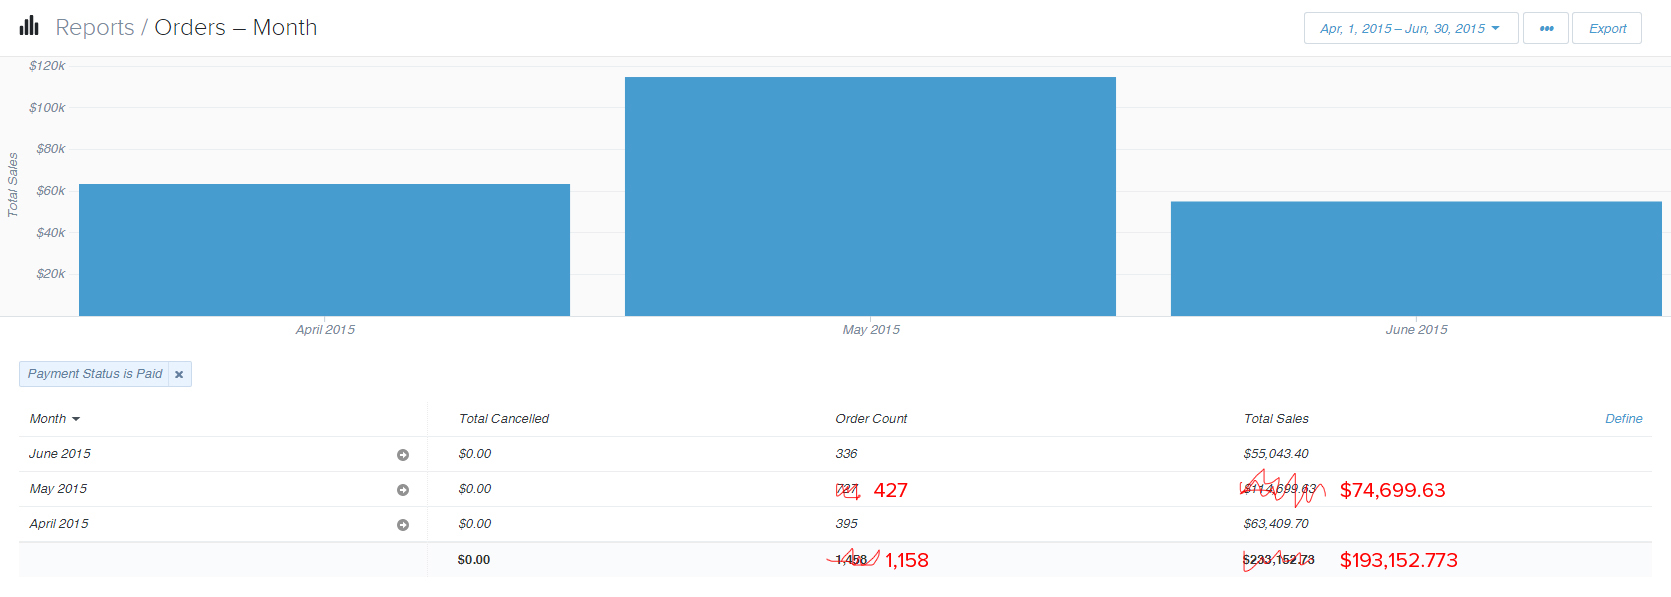
So the ones of you who are paying attention are now thinking, what’s with the revenue spike in May of 2015?!
Due to a marketing effort with Vogue shopping night in May her monthly averages data is skewed.
There was no google analytics ecommerce data set up at the time to track conversions from referral traffic but we can see in her Shopify report that on the 20th of May (the night of the shopping event) she saw a huge spike in sales.
We can therefore attribute this spike to this one off event.
For the sake of the CRO process we will now remove this anomaly from the business objective planning data as this is not a recurring marketing effort.
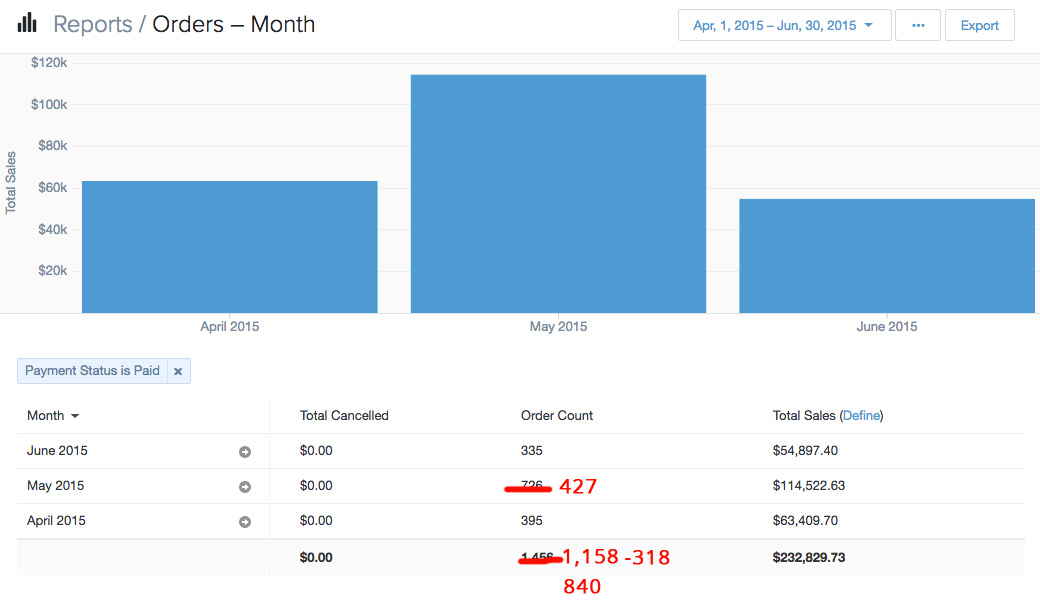
Here is the updated report.
Understanding sales channels
When we dig deeper into the analytics we find a large percentage of the sales come from a point of sale system in Charlotte’s physical shop in Sydney.
In fact 21.6% of all sales come from the retail store (or 318 sales from the 3 month period).
We will not be able to optimize this sales channel in the process. This would be a service design optimization process.
Let’s look at her corrected monthly averages.
(Corrected) Monthly averages for the last quarter
840 sales / 3 months = 280 average sales per month
$143,466.34 gross revenue / 3 months = $47,822.11 average monthly revenue
$47,822.11 / 280 = $170.79 average basket or order value
Traffic & Conversion Rate
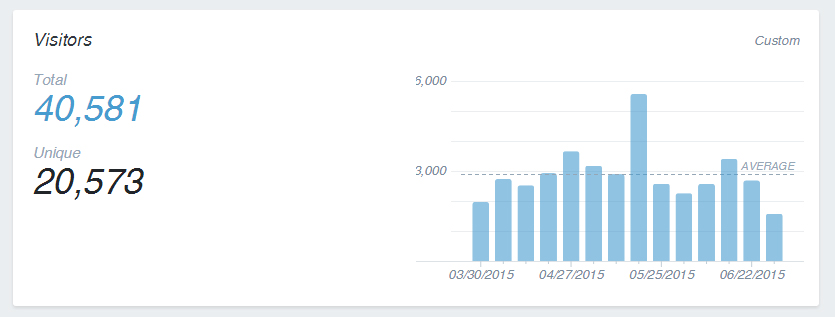
The current traffic for the store is as follows:
(The data we will look at is from the 1st of April until the 30th of June 2015)
Charlotte has a lot of return visitors monthly. Unfortunately as her Google Analytics is not set up to track conversions we cannot at this stage understand what percentage of those quarterly sales came from returning visitors.
We will investigate this during the CRO process.
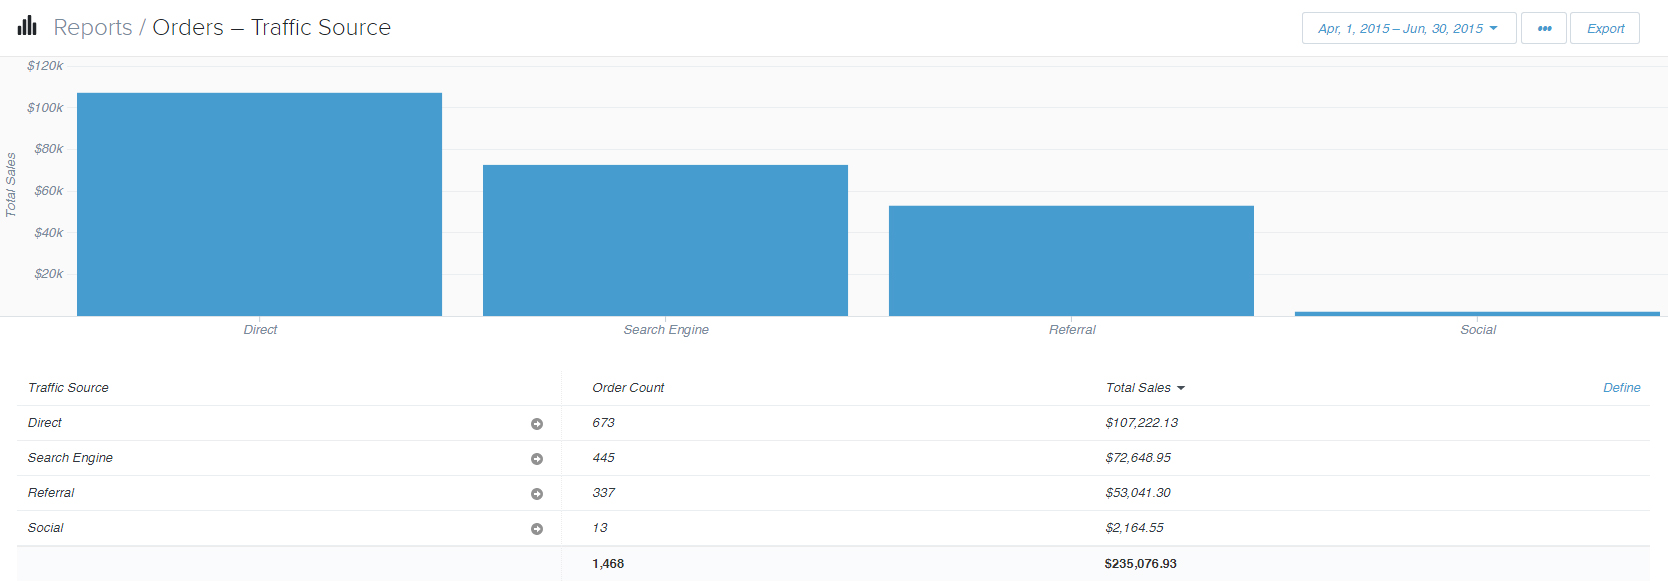
Most of her sales are coming from direct none, which means people are putting her website name straight into the browser.
This is often due to Instagram marketing for fashion ecommerce websites.
Charlotte also does most of her marketing in print magazines. Where she gets a lot of exposure due to her personal network, this was created through her work as a makeup artist.
Again from this marketing you would expect direct none traffic.
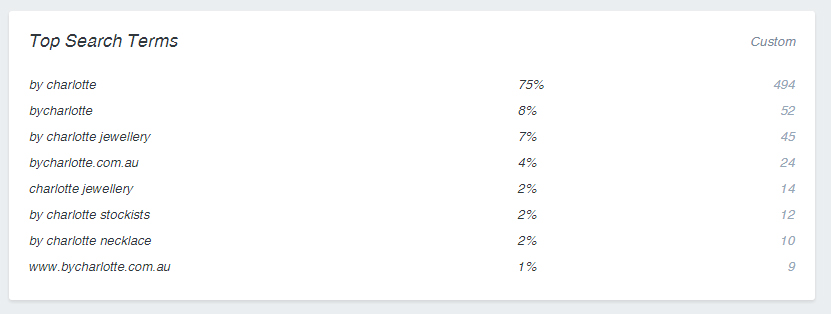
This is confirmed and echoed by her top search terms, which are all brand search terms.
Growth Opportunity: This indicates a huge potential to rank in Google using SEO. Targeting keywords for jewellery to drive more traffic and sales to her business. For example the search term: ‘jewellery australia’ has 880 monthly unique searches. This is a currently untouched marketing channel for By Charlotte.
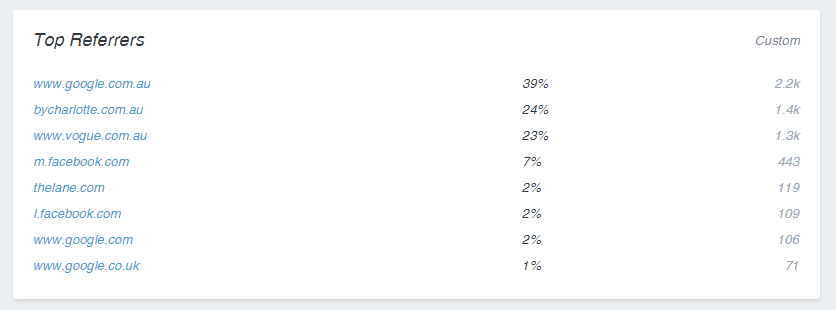
Her current top referrers are as expected, brand name, google (brand name) and vogue (the shopping night). Again this shows a huge potential to drive more traffic to her website.
Growth Opportunity: We can leverage guest posting on large fashion blogs using her personal network to drive more traffic and sales to her business. We can reach out to the magazines she is already featured in and pitch guest posts to their online counterparts.
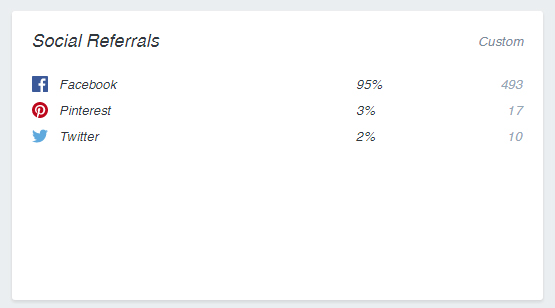
Her top social referrals are from Facebook, I believe there is a huge opportunity for her to monetize Pinterest here and perhaps other visual social networks like Tumblr.
Growth Opportunity: Invest in Pinterest marketing (food and fashion are the top two topics on Pinterest and their user base in predominantly women, a great fit for Charlotte’s products.)
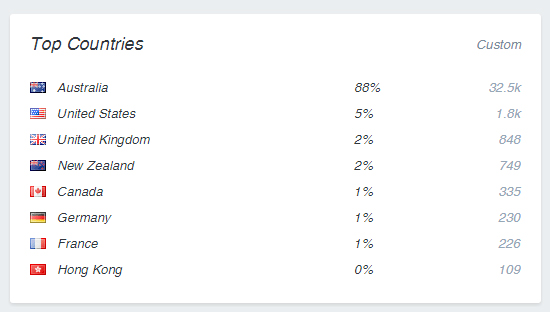
The majority of her sales come from Australian customers. This means we should dig deeper and understand conversions by country and see how personalization and location focused marketing could help grow her business.
Growth Opportunity: Understand how to convert people from outside of Australia, dig deeper into international shipping costs and delivery times.
Charlotte currently builds an email list from her online store, she then drives traffic and sales to the business through email marketing.
Her Google Analytics account is not currently tracking the number of new emails collected per month.
To improve her conversion rate from visitor to email subscriber we can a/b test better pop ups and lead magnets.
During the CRO process we can learn what percentage of her sales come from email marketing and how to optimize this part of her business.
Growth Opportunity: By understanding what lead magnets generate the most emails from Charlotte’s traffic we can increase her list size and drive more monthly sales to her business via email marketing.
Calculating our business objectives from her current data
Ok so let’s get down to the meat and create some business objectives!
Her current average conversion rate is 2.83%.
(Later in the series we’ll learn to segment conversion data for different sales channels).
This includes the Vogue shopping night traffic which cannot be segmented at present.
(2.83% of 40581 visitors = roughly 1150 sales)
Let’s look at the average ecommerce conversion rate.
The global ecommerce conversion rate benchmark in Q4 of 2014 according to Monetate was 2.84%.
So Charlotte is bang on the money.
But who wants to be average!
A good benchmark to try and increase your conversion rate is 5% month over month, or 15% quarterly.
So after our first round of a/b testing we want to try to increase the conversion rate to 3%.
(2.83% to 3% = roughly 6% increase in conversion rate)
This might not sound like a lot…but…based on Charlotte’s current monthly average sales and average basket value data her business would improve as follows:
Current: 2.83%, 280 average sales per month
Target: 3%, roughly 296 sales
Results: 16 more sales in month one * $170.79 average basket value = $2732.64
And this doesn’t even include the opportunity to increase the volume of traffic through SEO, guest blogging and social media marketing.
Compounded over the first year this 5 – 6% monthly growth would be worth a lot.
5 – 6% monthly growth all of a sudden doesn’t seem so bad!
NB: It will take more than one month to run a statistically significant a/b test for this store because of the current number of unique visitors and conversions is low. The test would take a few months to run, we will try to reduce this time by increasing traffic with the outlined growth opportunities.
Business Objectives
So our business objectives are as follows:
- Business Objective: Increase our sales by receiving online orders for our jewellery
- Business Goal: Increase the number of pieces of jewellery that are sold
- KPI: The number of pieces sold per month.
- Target: 296 sales month one
Quant based marketing
We can now use quant based marketing to work out our monthly target to a weekly and daily target to track.
That way we know if we are on course.
Monthly target: 296 sales
Weekly target: 74 sales
Daily target: 10.5 sales
Every day you can then check in on your target vs actual target and make adjustments where necessary.
Step 2: Create a customer theory
A customer theory is a formal representation of your customer understanding.
It represents who you think your customers are, their problems and their motivations around buying your product or service.
Your customer theory includes three documents:
- Brand positioning statement
- Value proposition
- Customer persona
The value of a customer theory is to document your customer learning.
Your customer theory should guide all parts of your business, especially product strategy, marketing and sales.
You should also attempt to iterate on your customer theory with every optimization process and every a/b test you run.
This gives your optimization efforts and a/b tests a focus.
So even if your a/b test loses.
You still improve your customer understanding and therefore win regardless.
We created a customer theory for Charlotte and will iterate on it during the optimization process.
(Sign up to the series to see the By Charlotte Customer Theory & CRO Report)
Step 3: Google Analytics Audit
Now what most people do is jump in and start collecting data.
But before you do that you need to make sure you are collecting not only the right data but clean data.
The truth is, most Google Analytics accounts are set up wrong.
Here is a checklist for making sure your ecommerce google analytics account is set up correctly.
1. Time zone country or territory
Make sure your Time zone country or territory settings are correct. Also ensure they are the same as your store settings (especially for Shopify users)
That way sales will fall into the same day or time period and your two analytics accounts won’t have conflicting data.
Navigate to your Google Analytics & Shopify administration accounts as below and set the correct time, ensuring both admins match:
Navigate to:
Google Analytics > Admin > View > View Settings > Time zone country or territory
Shopify Admin > Settings > General > Standards and Formats
2. Site Search Settings
Check that your site search data collection is enabled. This will allow you to understand how site search functionality affects conversion rates and profits.
Navigate to:
Google Analytics > Admin > View > View Settings > Site Search Tracking
Toggle on the ‘Site search Tracking’ and enter the query parameter, for Shopify it is the letter ‘q’.
This is the letter that shows up in the url when a search is performed and allows Google Analytics to record the data.
3. Google Analytics Goals
Now, when using Google Analytics to track an ecommerce store you should not use Goals to track conversion and conversion rate, use Ecommerce tracking instead.
You can and should however track your email list building and visitor to lead conversion rate using goals.
Here is a quick step by step to set this up:
Navigate to:
Google Analytics > Admin > Goals > New Goal
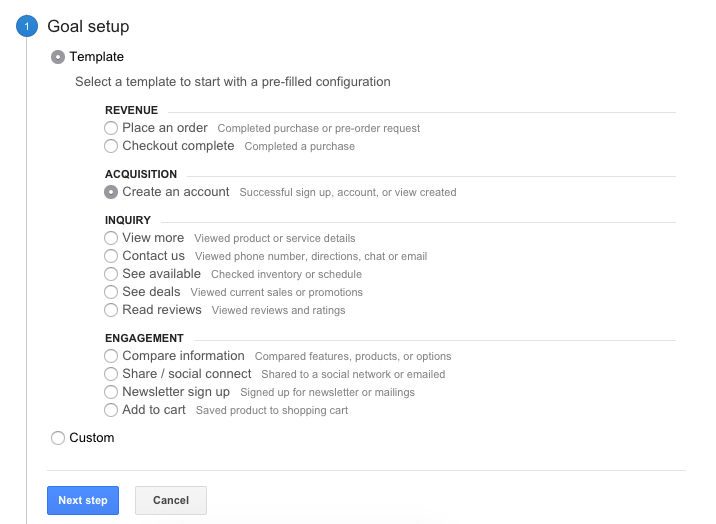
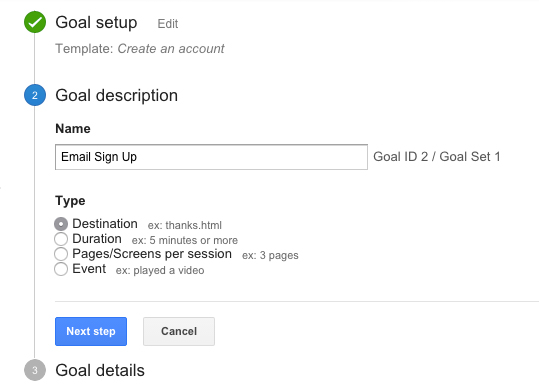
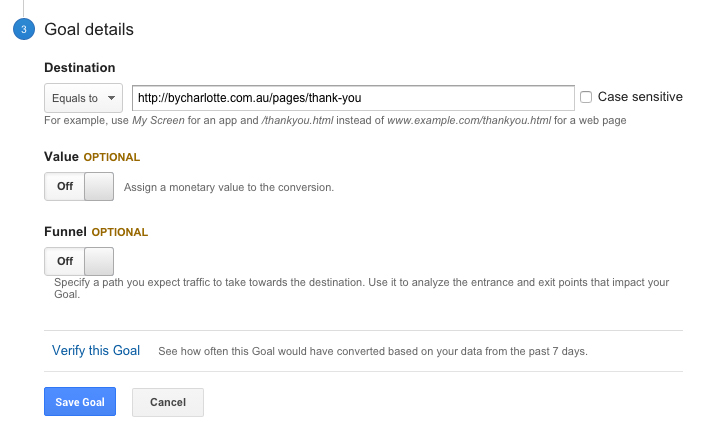
Click on ‘New Goal’ and go through the below step by step:
Step 1: Choose the ‘Create an account’ goal template
Step 2: Name the goal and choose the ‘Destination’ goal type
Step 3: Enter the destination of your thank you page
This is the page on your site that people are forwarded to once the subscribe form is submitted. If this is not on your website, you need to change this. Here is a guide to learn how for Mailchimp and for Campaign Monitor.
Click on ‘Verify this Goal’ to check if people have been reaching this page when signing up and to confirm that Google Analytics will collect conversion data.
If your alert message shows 0% your destination url is wrong (or you’ve previously been sending sign ups to an external thank you page).
4. Filter traffic
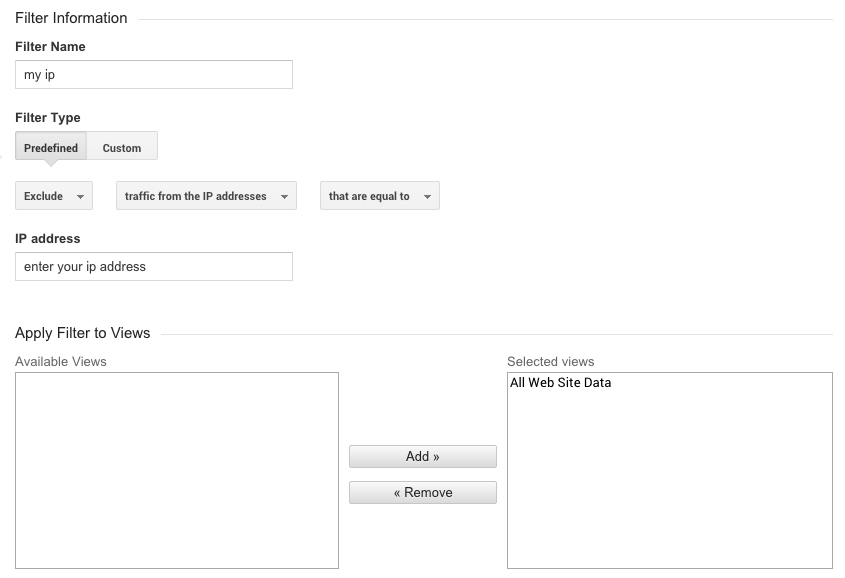
To make sure traffic from your developer or you or your staff don’t get counted in your analytics data, you need to filter out traffic from your IP address.
Here is a step by step for how to do that.
Navigate to:
Google Analytics > Admin > Account > All Filters
Step 1: Click on the ‘New Filter’ button
Step 2: Complete the filter form
Follow the settings as shown below in the image, just swap out ‘enter your ip address’ for your ip address instead.
5. Ecommerce Settings
Probably the most important settings is your ecommerce settings.
Navigate to:
Google Analytics > Admin > View > Ecommerce Settings
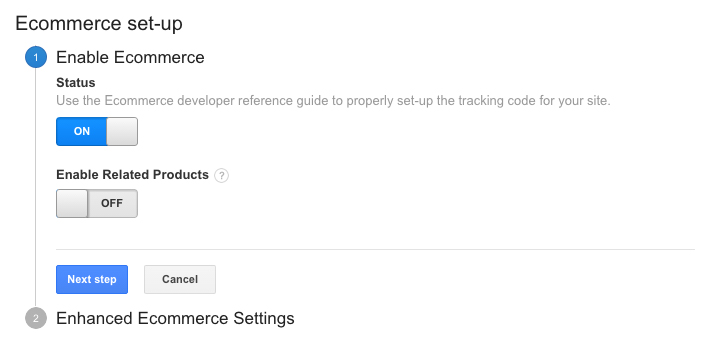
Step 1: Enable ecommerce settings
Toggle the Status switch on.
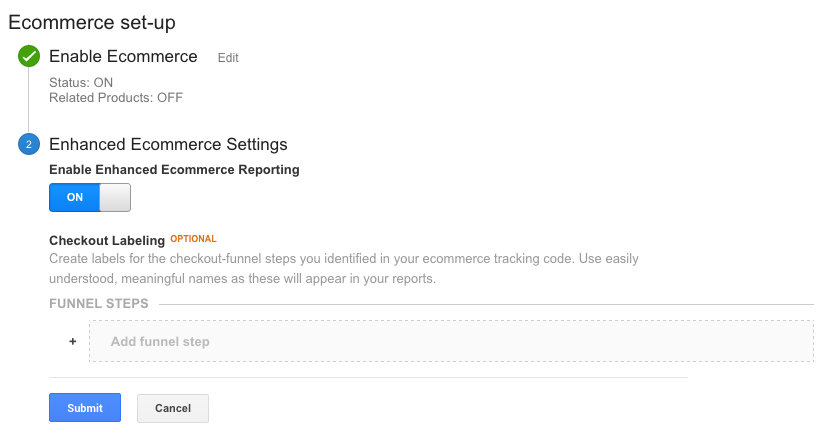
Step 2: Enable enhanced ecommerce settings
Toggle the enhanced ecommerce settings on.
I advise to leave the checkout labeling blank.
6. Property Settings
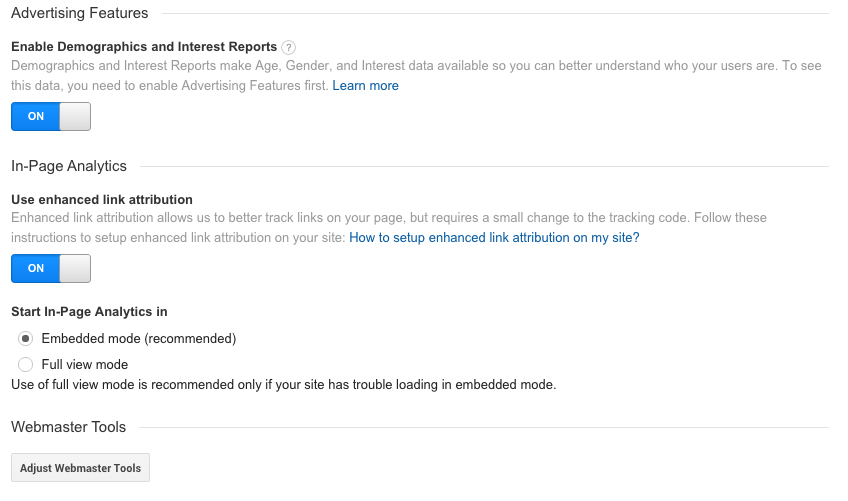
Next up you need to make sure you have ‘Demographics and interest reports’ and ‘In-page Analytics’ enabled.
These will help you understand better how demographics affect your conversion rates and how people behave on your website.
Navigate to:
Google Analytics > Admin > Property > Property Settings
Step 1: Toggle on demographics and in-page analytics
Toggle on the switches and click save.
Step 2: Update your tracking code
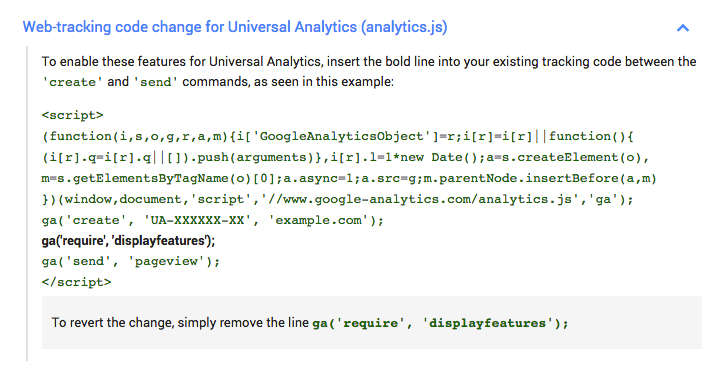
Next you need to add two lines of code to your tracking code.
To find your tracking code.
Navigate to:
Google Analytics > Admin > Property > Tracking Info > Tracking Code
Copy and paste this code into a text document.
Then update your tracking code to include the enhanced link attribution in-page analytics code.
And update it to include the display features code for demographics and interest report tracking.
Once added your code should go from this:
To this:
Basically you add ga(‘require’, ‘linkid’, ‘linkid.js’); and ga(‘require’, ‘displayfeatures’);.
Make sure this code is present on every page in your website. To do this for Shopify include it in the theme.liquid file or for WordPress include it in the footer.php/header.php file.
7. Webmasters
Ensure your Google Webmaster’s account is connected to your Google Analytics profile.
Navigate to:
Google Analytics > Admin > Property > Webmaster Tools
Connect your Google Webmaster’s account, it should be set up using the same email as your Google Analytic account.
8. Use Google tag manager
You can also use Google tag manager to organise and manage your tags, this is great for non technical people.
Your site will then track demographic and interest report and in-page analytics data.
What types of qualitative and quantitative data to collect
Now your Google Analytics account is set up correctly we are going to collect qualitative and quantitative data to inform our a/b test hypotheses.
Data we will collect:
Mouse tracking
This will teach us how people behave on the website, what items we want them to click they are missing and what items are being clicked that shouldn’t be (items that are a distraction to the conversion!)
User testing
We’ll capture user sessions on the website and learn how people navigate around the store. We’ll analyse this data to learn user behaviour and find roadblocks in the stores sales funnel.
Live chat
Charlotte’s team will chat real time with customers during office hours to answer queries and reservations they have around the sale.
We’ll analyse the live chat transcripts to find ways to improve the store and remove the reservations shoppers have (increasing the number who checkout)
Customer Surveys
Survey Charlotte’s existing and potential customers (leads) to learn how to better position the brand and refine Charlotte’s value proposition and differentiators.
Poll users on Charlotte’s store in real time, asking them questions at key points in the sales funnel (especially at drop off points to learn why they are bouncing)
Usability Evaluation
We’ll perform an expert analysis of the stores usability, considering ecommerce conventions and best practices.
On page SEO audit
We’ll audit the on page SEO of the store to improve search engine ranking and organic traffic.
Accessibility evaluation
Audit the accessibility of the store and improve markup, this in turn will improve search engine ranking.
Sales funnel audit
We’ll dig deeper into the stores sales funnel, segmenting data and creating funnels manually to double check funnel data. Once we find where the traffic is leaving the sales funnel we’ll use qualitative data sources to try to understand why.
Browser & device conversion rate audit
Learn which browsers and devices require more optimization and if there are any functional errors in the store.
Internal search audit
We’ll learn how internal search affects conversion rate and audit the search functionality.
Shopping cart abandonment audit
Learn what percentage of shopping carts are being abandoned and put systems in place to reduce the number of lost sales.
Rounding up part 1
That concludes part one in this five part ecommerce conversion rate optimization series.
So far we:
- Created business objectives
- Created a customer theory
- Audited the Google Analytics account
- Started to collect qualitative and quantitative data from Charlotte’s website
In the next post we’ll look at:
- Ecommerce best practices & conventions
- Ecommerce best in class websites
- Popular ecommerce features and functionality
- How conventions fit into a CRO process
Increasing Ecommerce Sales
As an ecommerce entrepreneur it is important to be constantly iterating on and improving your store.
Ecommerce conversion optimization can help you to increase the percentage of your visitors who checkout.
But you must remember, conversion optimization is a process, one that includes collecting and analysing not only quantitative data but qualitative data too.
Quantitative data is mostly collected through analytics software like Google Analytics. Qualitative data is collected through an exploration of user behaviour.
Quantitative data can teach us what happened, where and how much, but we need qualitative data to learn why.
Remember, what conversion optimization is really about is increasing your conversion rate and profits through a deeper understanding of your customer.
Let me know about your process for increasing your ecommerce conversion rate in the comments below.
Just say, ‘Hey Giles, we measure ____ & ____ to learn how to increase our ecommerce sales’.
