What you’ll learn:
- How customer research fits into a complete conversions process
- How to use Google Analytics content reports to inform customer research
- How to collect qualitative customer data with website and exit intent technology
- How to analyse qualitative data and create test hypothesis
- Customer research toolkit: 25 conversion rate best practices to consider in your next landing pages design or optimization process
A complete conversion rate optimization process
As with any business task, when you are optimizing your landing pages conversion rates you need a process.
In this article you are going to focus on using customer research methodology to help increase conversions, but to better understand your workflow first I’ll show you how this type of data collection fits into a complete conversion rate optimization process.
Customer research definition
Customer research is a very broad term and encapsulates more traditional processes such as market research as well as more modern optimization processes.
In our case customer research means a study of your customers behaviours.
How not to run landing page tests
Many marketers blindly test ideas. They change something on their landing page, a headline, some button copy and see if it increases conversions.
Does this ring any bells?
This type of testing rarely results in sustainable improvements.
It also does not help you learn and develop your understanding of your customer over time, which should be one of your two main focuses in a conversion optimization process.
The other is increasing profits, not conversions but profits.
Increasing conversion is easy, lower the price, make it free. Increasing conversions profitably is another story altogether!
What your conversion process should look like
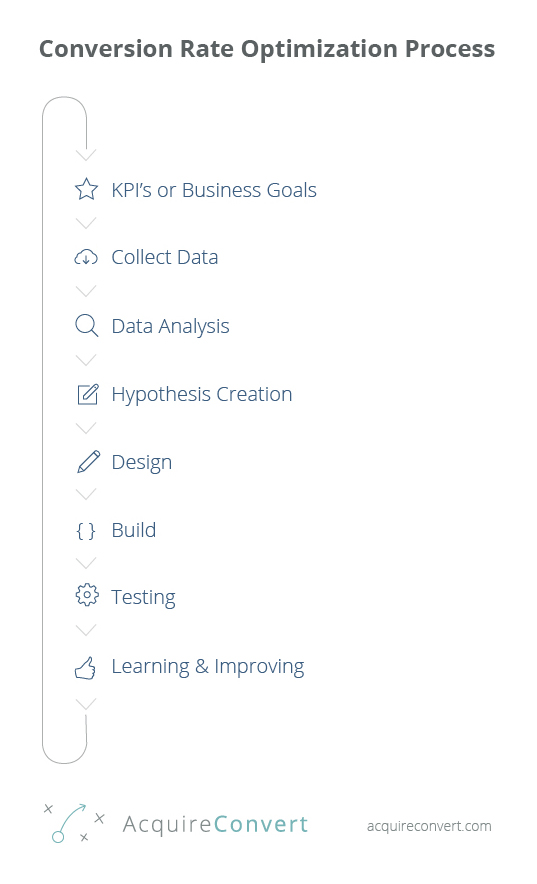
Here is a diagram of your new conversion optimization process:
Step One: Business Goals
The first step is to decide on your business goals, in this case it may be to increase your landing page conversion rate by 5% month over month for example. As with all growth efforts you need a marketing plan.
Step Two: Data Collection
Secondly you need to collect data. Now when you think of data to collect you instinctively think about digital analytics, this is the first type of data, quantitative data.
Quantitative data tells us what, which page, how much.
The second type is qualitative data and this is collected through an exploration of user behaviour.
This customer research process helps you gain an understanding of the reservations and motivations your customers have throughout their path to conversion along your sales funnel.
The qualitative data you will collect in this process is website and exit intent surveys.
The amount of different data sources and types of data you collect can vary depending on the type of conversion project, budget and timescales.
Step Three: Data Analysis
In this step you analyse the data you have collected, in your case from your website and exit intent surveys.
Step Four: Hypotheses Creation
The data informs ideas for ab and multivariate tests to run on your landing page. You prioritize the tests based on a number of factors and decide which tests to run first.
Step Five/Six: Implementation
Here you design and code your new landing page variation ready for testing.
Step Seven: Testing
You run tests, with your original landing page design as a control and measure for improvements in conversion rate and most importantly profit.
Step Eight: Learning and Improvement
In this step you analyse the test results, looking for a winning variation (with statistical significance). You learn from the results and start the process all over again with new ideas for data collection and testing.
Remember, conversion optimization is not one and done.
How to use Google Analytics content reports to inform customer research
With the entire process for optimizing your landing page covered and your business goals set, it is time to start collecting data.
You are going to collect qualitative data in the form of website and exit intent surveys.
In my experience this is one of the most effective customer research methods.
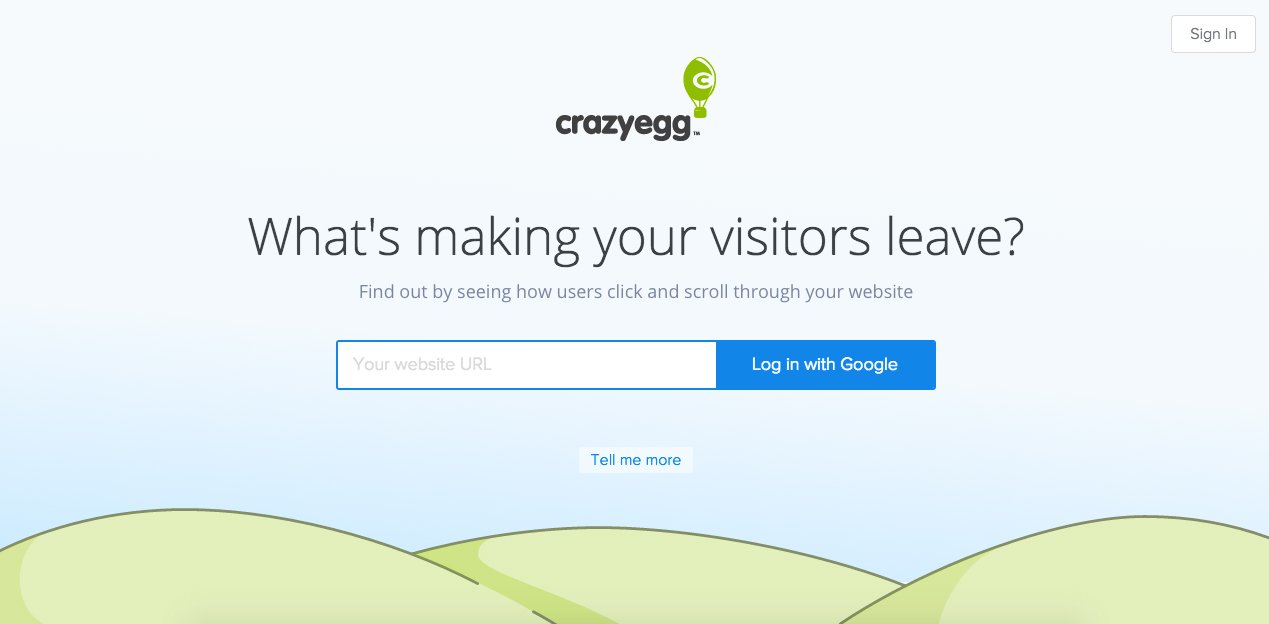
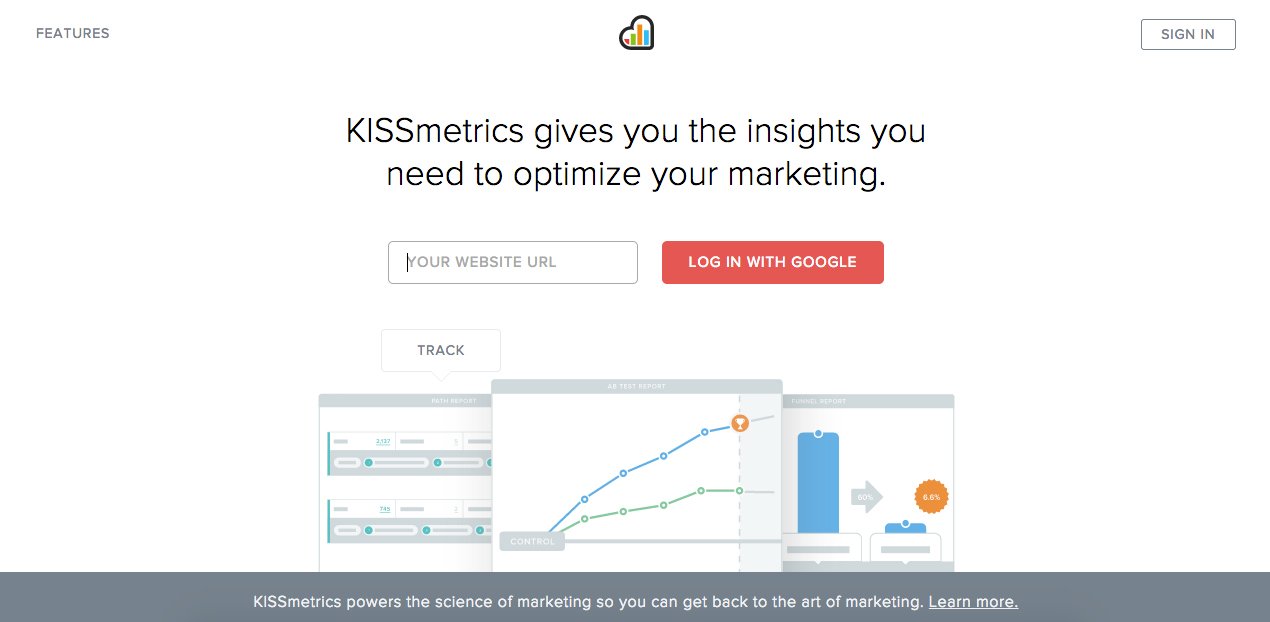
Website and exit intent surveys are also referred to as pop up surveys, you may recognise them in this form:
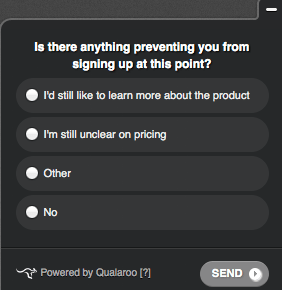
They allow you to survey your website visitors, the surveys show up after a specific period of time (like after the visitor has been on the page for 30 seconds) or using exit intent technology.
What is Exit Intent Technology?
Exit intent basically means that the survey is shown when the user tries to leave the page or moves their mouse towards the browser window cross to close the window.
To help us decide what surveys to run and on which pages you are going to dig into your Google Analytics accounts, specifically your content reports.
How to segment your Google Analytics content reports
In order to increase the conversion rate of your landing pages you first need to learn which landing pages are performing the worst.
Poor landing page performance can be defined as high traffic pages with high bounce rates or high exit rates. This means the pages that a lot of your visitors land on when entering your website where they also leave instantly or bounce.
You specifically want to find pages with bounce rates that are higher than your websites average bounce rate.
Let’s dig into your google analytics and find your problem landing pages.
Step 1:
First click on the profile of the domain name you want export reports from in your google analytics account, this is called ‘All Web Site Data’ more often than not.
For example:

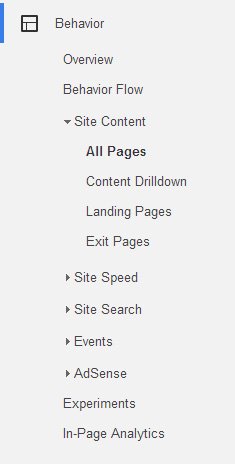
Step 2:
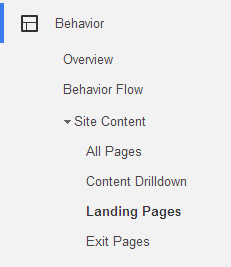
Next click on the ‘Behaviour’ > ‘Site Content’ > ‘All Pages’ tab.
Step 3:
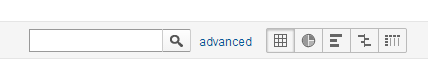
Click on the advanced tab and filter out all pages with less than 1000 pageviews.
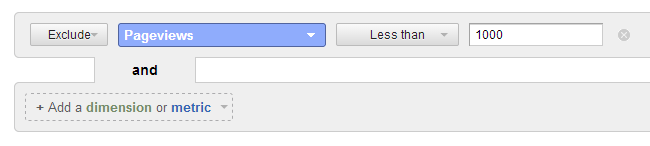
Choose an appropriate length of time in the date range to select a big enough sample size (dependant on your sites traffic) then sort the table by bounce rate with the highest bounce rates at the top.
Export this report to PDF, this will show you the pages with high traffic and high bounce rate, the real problem landing pages on your website.
Step 4:
Next click on the ‘Landing Pages’ tab
Step 5:
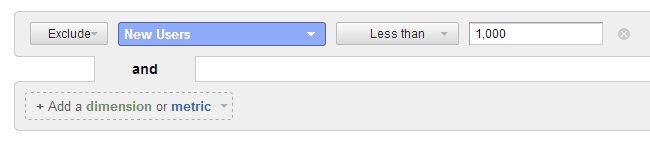
This time exclude new users less than 1000
Step 6:
Select the comparison view, the second tab from the right that is shown as selected in the image below.

Step 7:
In the first column select ‘New Users’ and in the second column select ‘Bounce Rate’
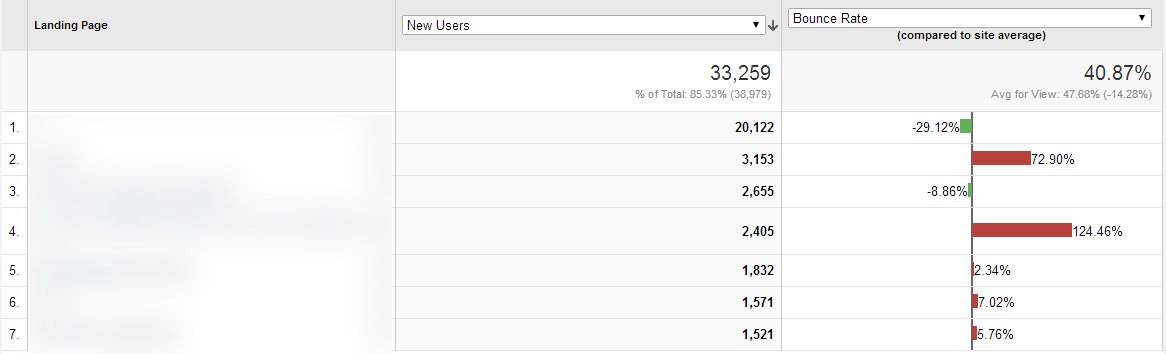
Export this report to PDF, this will show you the high traffic pages with higher than average bounce rates for your website (the ones with the longest red lines). These pages need the most optimization work.
Step 8:
In the second column, change the selection to ‘Goal Conversion Rate’
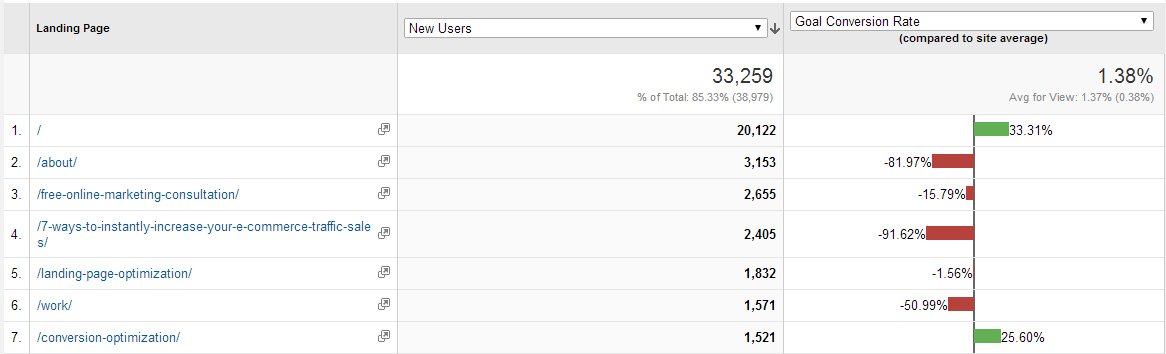
Export this report to PDF, this will show you the high traffic pages with lower than average conversion rates! Bingo. These are the landing pages where you need to improve your conversion rate.
Of course you do not have to optimize pages based on your Google Analytics reports, if you have specific landing pages from current campaigns or business critical landing pages that require conversion optimization then you can simply choose to optimize those pages in this process.
Qualitative research: Creating your survey questions
Now you know which landing pages you are going to optimize based on your Google Analytics data or current campaigns, you need to set up website and exit intent surveys on those pages.
The next step in the process is to decide:
- How many pages to run surveys on
- What questions to ask / what question formats to use
- Whether the survey should show based on time on page or intent to exit
- How long to capture data for
How many pages to run surveys on
The number of surveys you run does not correlate to the number of pages you intend to optimize, you can run surveys on pages you don’t intend to change and use the data to strengthen your core customer theory and customer personas.
It does however make sense that the page you are optimizing has at least one survey running on it.
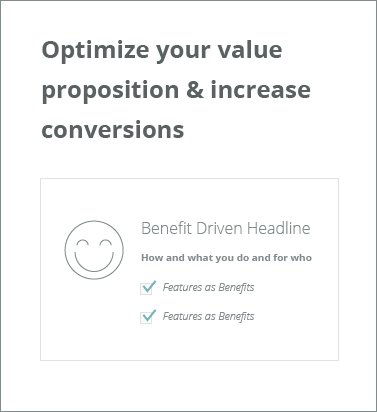
What questions to ask / what question format to use
As with all customer questioning the greatest learnings come from asking open ended questions.
The format of the questions can affect this greatly.
Having a question with multiple choice answers assumes you know what the options should be.
Having a questions with an a text input answer allows for learning outside your assumptions, therefore new learning.
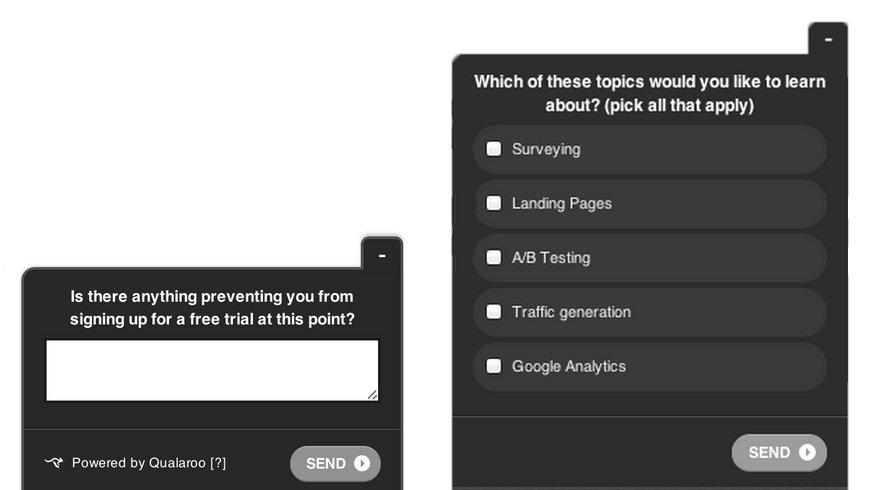
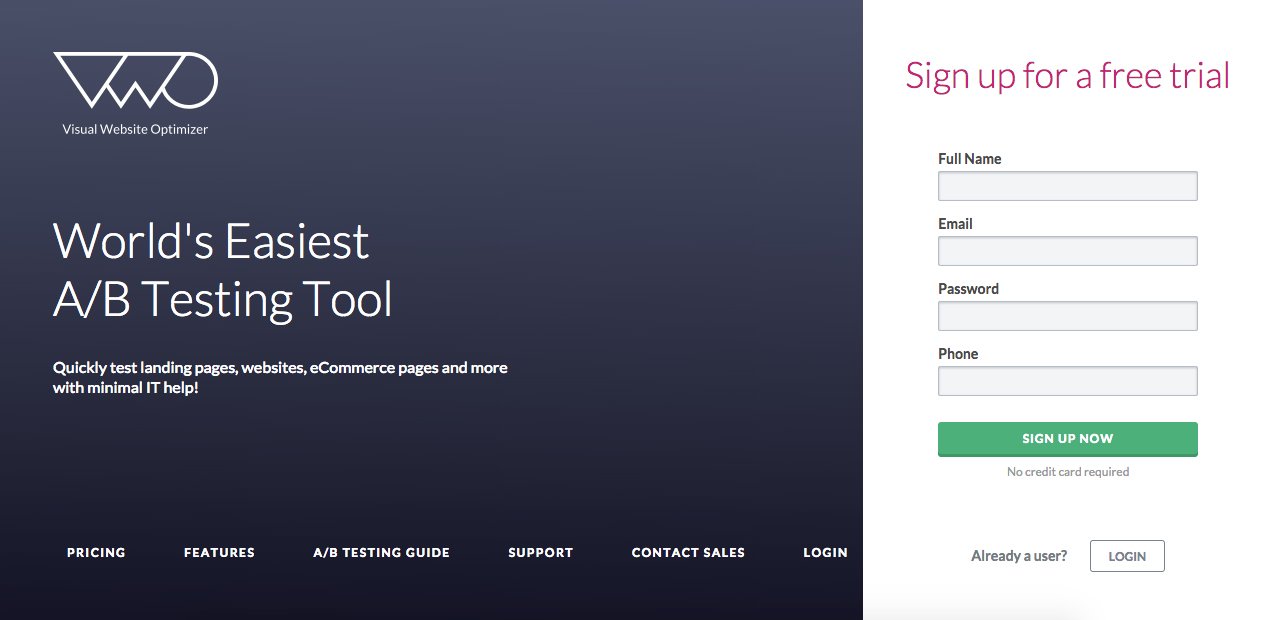
Unfortunately in my experience the conversion rate of text input questions is much lower than multiple choice as the perceived friction to complete is much higher for the user.
Basically, when you look at the form on the left it looks like a lot more effort to complete than the form on the right! right?
The way you write your questions will also impact the learning, again make sure not only the question format is open but the questions are open ended too.
Should your survey show based on time on page or intent to exit
Deciding on whether to show your survey based on time or exit intent often comes down to the type of page in question.
Exit intent
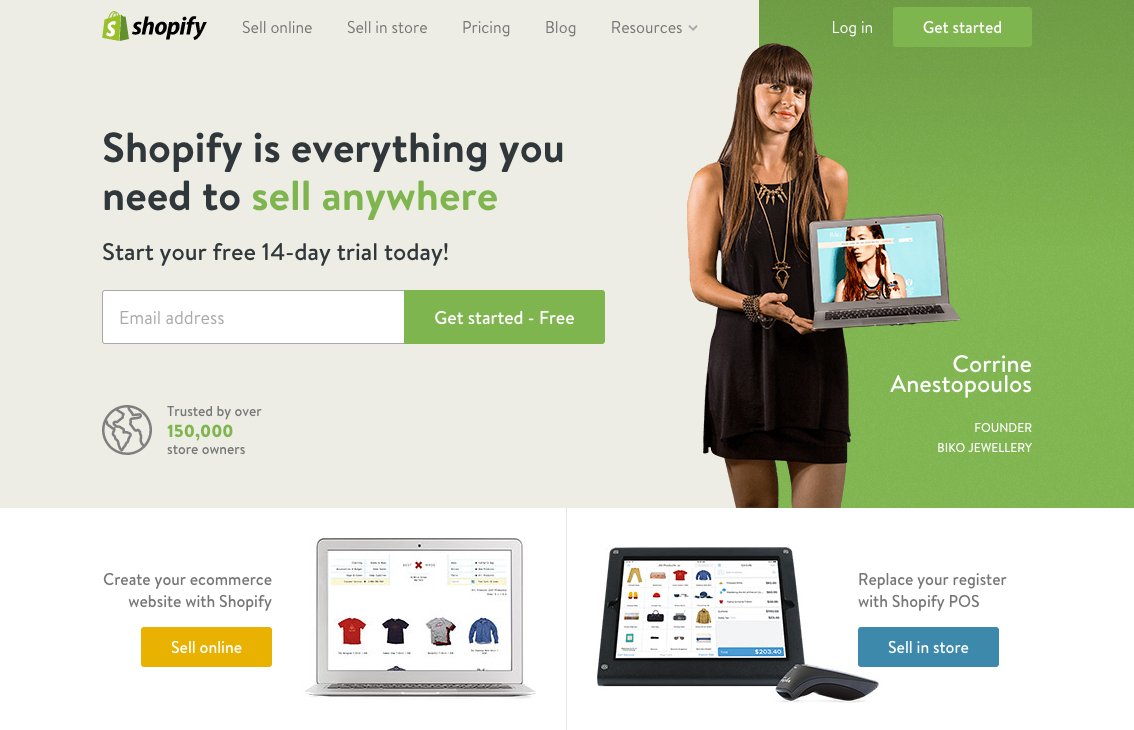
If the page is a key or final step in your sales funnel that would naturally see high abandonment e.g. a cart page on an ecommerce website or the checkout page for an information product.
Then I suggest you use exit intent, that way when the user goes to abandon the page you can try to learn why they leave. Helping you learn the barriers to conversion that need addressing in your redesign and testing.
For example:
Bfyne.com is a new ecommerce shop (10 months old) we created at Whole Design Studios, they were seeing adandonement on their cart page (as all shops have a percentage of) so we decided to investigate why to try to increase conversion in this step of their checkout sales funnel.
We asked visitors in an exit intent pop up that showed as they were about to leave the cart page and abandon:
“What is stopping you from checking out today?”
Here are a selection of the most common answers we received in the customers exact words:
- I want to be sure I can get this before the 30th with express shipping (sent on the 20th)
- How long does it take for my shipment to come if I order my shoes tonight
- When will I receive the item is I use standard shipping and I live in NYC (sent on 28th jan)
- Not sure if it will get to me by the time I need it
- Hello I am living in France and want to know if you send other country and if yes how
From these answers we can clearly see a huge problem with the cart page is communicating to the visitor when they would receive their product.
We are now running a test with a variation of the cart page with an expected delivery date calculator added.
Our hypothesis is that many of the visitors would have had their reservation around purchase removed if they had been able to calculate the expected delivery date.
We will then run a test using a javascript location detection plugin, so we can find a visitors location and update a dynamic banner that says:
“We ship to [location of visitor]”
E.g. If you are in France.
“We ship to France.”
With any detailed information around price changes inline alongside the message.
Time on page
If the page is not a final step in a sales or lead funnel but still receives high traffic and potentially high bounce rates like a homepage or product feature page for example then you should show the survey based on time on page.
To determine at which point to show the survey you should look at the pages time data in Google Analytics, let’s learn how:
Step 1:
Go to your Google analytics account and navigate to the ‘All Pages’ report.
Step 2:
Search for the name of the page you are optimizing
Step 3:
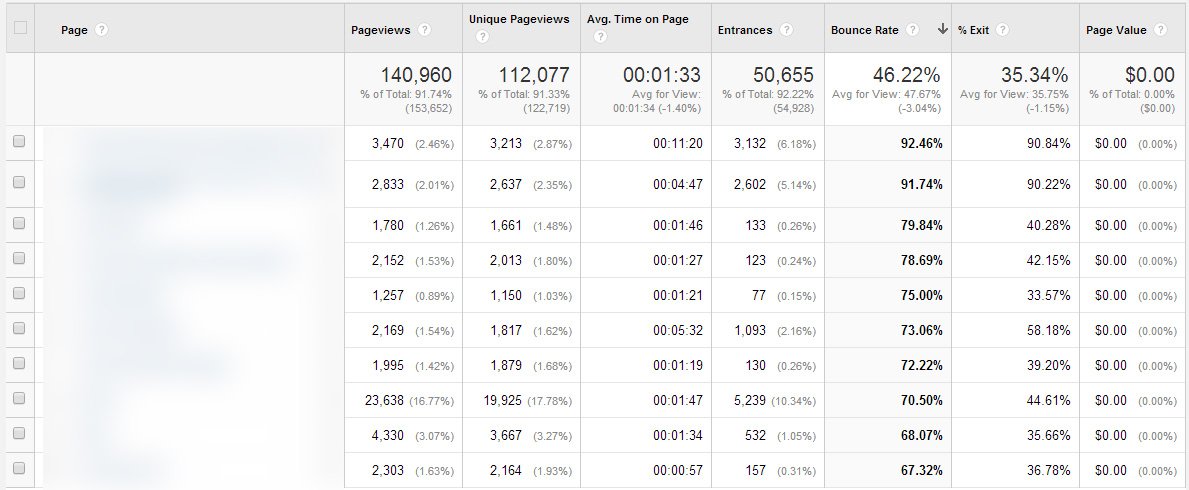
Look at the ‘Avg. Time on Page’ column for your page
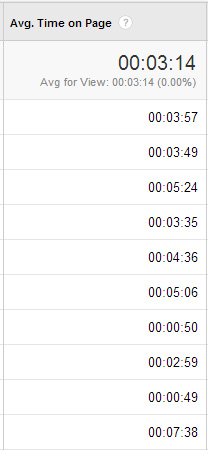
If your average time on page is high then do not show the survey too early, the longer a person stays on the page the more aligned they are with the content, the higher quality they are as a lead and the more relevant their data will be to help build your customer theory.
I suggest to show the survey after 20% of the average time on page, so for row one in this instance you would show the survey after around 50 seconds.
However if your traffic is very low then show the survey earlier or you will not capture enough data, don’t forget only a small percentage of those that see the survey will complete it.
How long should I capture data for
The amount of data you collect depends on the format of your question.
If you are collecting multiple choice question data then you want to reach statistical significance.
This is calculated using Pearson’s chi-squared test, this is a chi-square goodness of fit test, with the null hypothesis being equal probability for all of the possible answers.
If you are collecting text answers then there is no right or wrong amount, normally you will start to see repetition after only 20 or so form submissions.
Once you are confident that the visitors answers are repetitive you can stop collecting data.
Implementing surveys
To make collecting survey data technically easy you can use tool such as Qualaroo or Hotjar which enable website and exit intent surveys.
The cheap alternative is for you to code it yourself or get your developer to set it up.
The easiest and quickest way to do this is using a free form app like Wufoo and a pop up plugin like Reveal.
Wufoo is better than simply submitting the form to an email address as it allow you to export the data into a report without having to manually trawl through the emails.
For the exit intent technology you can use this Ouibounce which is free.
To trigger the form after a period of time you can use jQuery .delay() method.
Analysing your qualitative data for hypothesis ideas
Now you have discovered your problem landing pages and run and collected survey data, it is time to analyse and interpret that data.
Analysing Multiple Choice Data
To analyse multiple choice data you need to dig into statistics and the previously mentioned chi-square goodness of fit test. However this is complicated enough to warrant an entire article, here is a step by step if you’re into maths.
Example:
Here is some sample data we collected at Whole Design Studios when optimizing landing pages for Berlin based ed tech start up CareerFoundry.
We were trying to understand the core motivation behind why their visitors were interested in user experience design as an input to their customer theory and course value proposition.
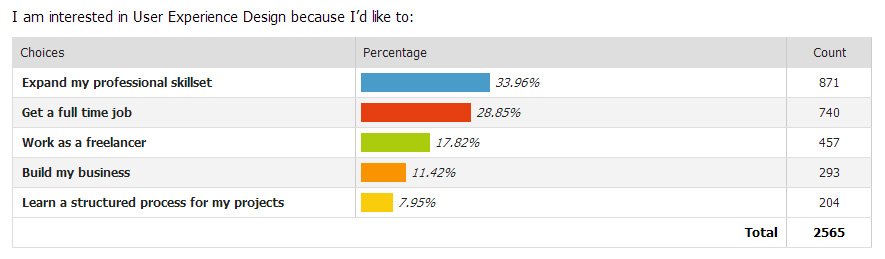
To analyse this data we used the chi-square goodness-of-fit test as mentioned earlier.
One test idea to take from this test is that expanding their skillset is the most important motivator for visitors. You could test this in a value proposition.
At this point you would add this idea or hypothesis to a spreadsheet in order to rank your test ideas after you’ve analysed all your data (more on this later).
Analysing Single Text Input Data
There are a number of ways to analyse the text input question data.
Word Cloud
My favourite and the first exercise I always perform is to grab all the text answers and place them into a word cloud.
This way you can see the most common and recurring words and learn about the customers behaviour and mind set.
For example:
We ran a survey for Career Foundry to learn why visitors didn’t want to sign up, asking:
“What’s stopping you from signing up?”

After placing the raw text input answer data into a word cloud we found recurring words such as:
- sure
- looking
- comparing
- concerns
- money
- price
- expensive
- location
This told us the visitors decision was a very considered one, with comparison shopping as part of their process. Also that price point and therefore perceived value was crucial in their decision making process.
After digging further into the recurring word location we learned in visitors answers that they were unsure if the online course could be accessed from anywhere in the world.
What we learn here is to segment and dig deeper into our data to find more insightful answers.
Again you would add any test hypothesis or ideas to your spreadsheet from these analysis exercises for ranking after you complete all analysis.
Categorization
The second analysis exercise is to export your data into a google doc via a .csv in order to read and categorize answers.
This highlights what the biggest conversion barriers on your landing pages are and the main sections that need addressing in the redesign and build.
Add four columns next to your text input data, one for:
- General take aways or comments – e.g. they didn’t like X feature
- Categorization – e.g. feature 1, feature 2, pricing, to help spot trends re: what’s most important to your customers.
- To Do’s – e.g. Answer actions or additions to your hypothesis spreadsheet (we’ll cover this in detail later)
- Logged – Have the to do’s been assigned to a task list
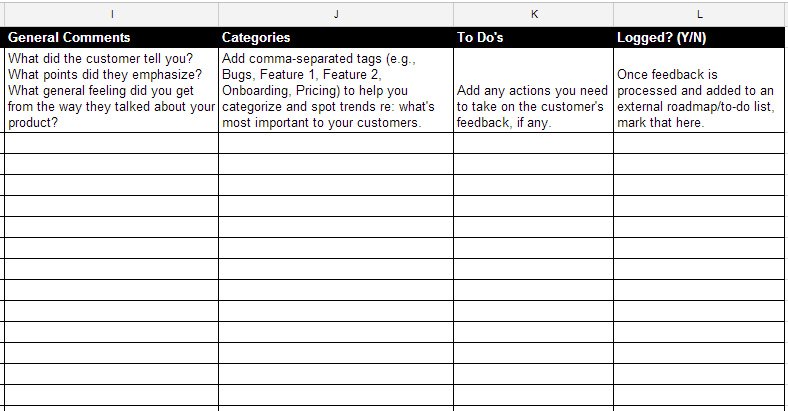
NB: You can get a copy of this spreadsheet as a google doc in the toolkit at the end of the article.
Prioritise Your Test Ideas
Now you’ve collected and analysed all your data you have a lot of ideas for testing.
You’ve added them all to a spreadsheet and now it is time to rank them based on a number of factors in order to decide what to test first.
When choosing which tests to perform you must first understand the time and cost implications of running each test and their resultant value. You can then choose first the tests with the least cost and highest return.
Here is a test score sheet you can use. Get the spreadsheet again in the toolkit.
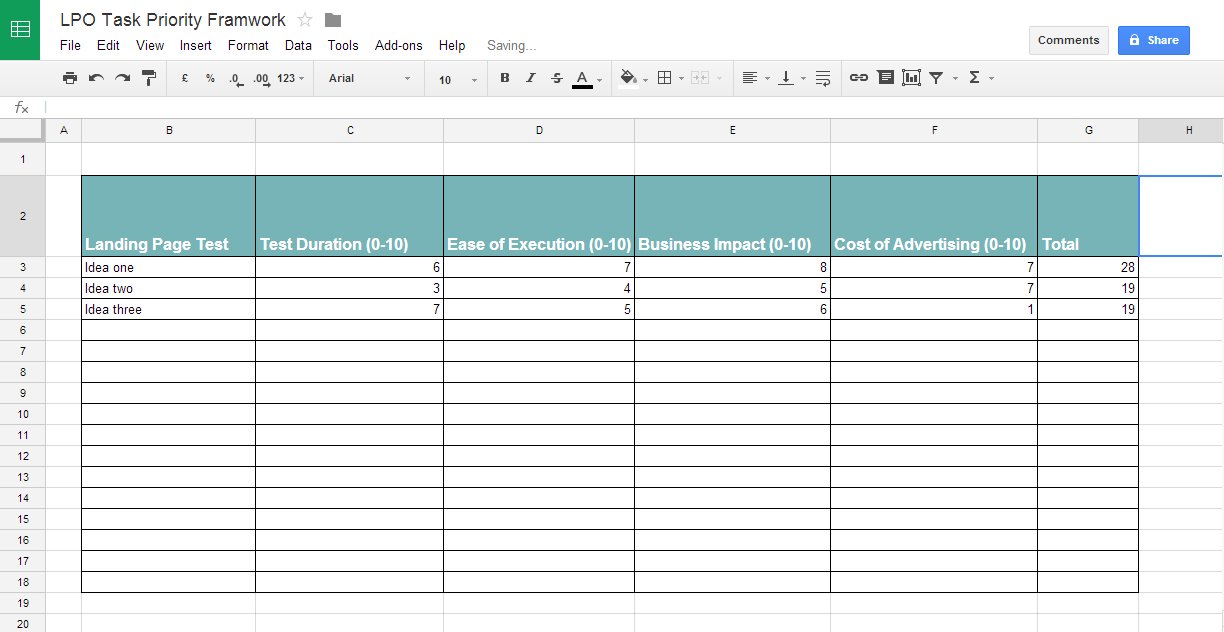
I’ll explain each column:
Test Duration
How long it takes for the test to reach statistical significance, shorter tests score higher.
Ease of Execution
The easier a test is to implement the higher it should score.
Business Impact
How much will this test change the business. The business! Not the conversion rate, not the revenue but the profit, the business. Big changes score high.
Cost of Advertising
How much will it cost to drive traffic to this page. If it is all organic traffic then a higher score is more appropriate, if it is expensive high competition keywords score it lower.
Overall the task or idea that scores highest is first in line to be implemented.
Now you have a framework to rank and prioritise your tests.
Building and testing your new landing page variation
After prioritizing your test ideas you know which test you will run first.
To run the test you must first update the design and build of the landing page and then test it against the original variation as a control.
Avoid sequential testing
Make sure to test your landing page variations at the same time using ab testing or multivariant testing software.
I’ve seen people collect data from one version for one week with 100% of the traffic and then swap to the new variation for one week with 100% of the traffic.
Ultimately then comparing the two different weeks results.
This is called sequential testing and is a bad ideas.
It’s not a fair comparison as it’s not the same traffic source or the same industry conditions.
Your conversion rate is not a fixed number, it can change between days of the week or from season to season.
You have to split the traffic and test at the same time, hence why ab testing is also referred to as split testing.
You should never trust the results of sequential testing.
Learn and iterate
Once you have a winning variation it is time to update your customer theory and customer personas with your learning and start the data collection process again.
Try to track the revenue change as well as the conversion rate change as this is ultimately what you are trying to improve.
Remember conversion optimization is not one and done so keep iterating and developing your customer.